Showing posts with label graph. Show all posts
Showing posts with label graph. Show all posts
Friday, March 25, 2011

Monday, March 14, 2011
My favourite insult
About an hour and a half ago, I went offline (shock! horror!) so that I could duraseal the three volumes of Tax Law legislation that I bought today. My parting message in one of my Facebook conversations was "ttyl dork".
However, having thought about it for a few moments, I realised that being sensible does not necessarily preclude something from being dorky. In fact, the two are hardly mutually exclusive. Depressingly, most things that I thought of immediately after making this realisation were both dorky and sensible. See below:

A few minutes later, I received this text:
"Don't call me a dork, person durasealing their tax books!"
Good call. It is a rather dorky thing to do, prima facie. But they are massive and their covers are flimsy and if I took them to university in my bag twice a week then they would surely be destroyed, if left uncovered. So, my response (in my head) was:
"It's not dorky; it's sensible!"

Monday, January 17, 2011
I broke my smoothie maker
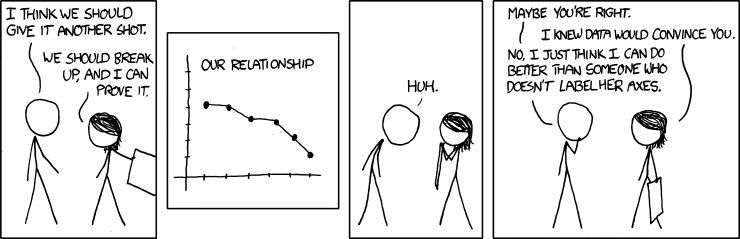
I have a newfound love both for writing mathematical equations and graphs out of jokes and other things that aren't inherently quantitative. I hope to feature a few of these on this blog in the future.
To start it off, I found this on one of my friends' Facebook pages:
I didn't actually make this myself*, but it is of course true of my milkshake. The drink, that is.

I didn't actually make this myself*, but it is of course true of my milkshake. The drink, that is.
*There are a few ways that you can tell this:
-the axes are not labelled;
-the units of the y-axis are not given;
-I would not have made the y-axis go up to 120 when it is measuring percentages in a situation where it is nonsensical to have percentages greater than 100%.
Subscribe to:
Posts (Atom)